Leadership asks how content is contributing to pipeline, and most content marketing managers answer with traffic numbers because that’s what they have. Traffic isn’t the question that was asked. The question was about leads and revenue, and without an attribution model, there’s no honest answer.
Full multi-touch attribution software is built for teams with dedicated analytics resources. Most content teams don’t have that. What they need is a lightweight model that’s directionally accurate and easy to explain in a monthly report, not a perfect data pipeline.
The real problem: content teams get judged on metrics they can’t report
Most content marketing managers’ success metrics include MQLs and pipeline influenced by content, alongside traffic and rankings. That expectation has only grown as more B2B buyers research using AI tools before ever visiting a site, making the path from content to lead harder to see with pageviews alone. But most content calendars and CMS dashboards only show pageviews and time on page. When a VP asks “what did this article do for pipeline,” the honest answer is often “we don’t know.” Not because the content didn’t work, but because nothing was set up to trace the path from article to lead.
This creates a credibility gap. Content teams that can’t show pipeline impact get treated as a cost center, not a growth lever, regardless of how good the writing actually is.
The framework: the Three-Touch Attribution Model
This model doesn’t require a full marketing attribution platform. It needs three things already available in most CMS and CRM setups:
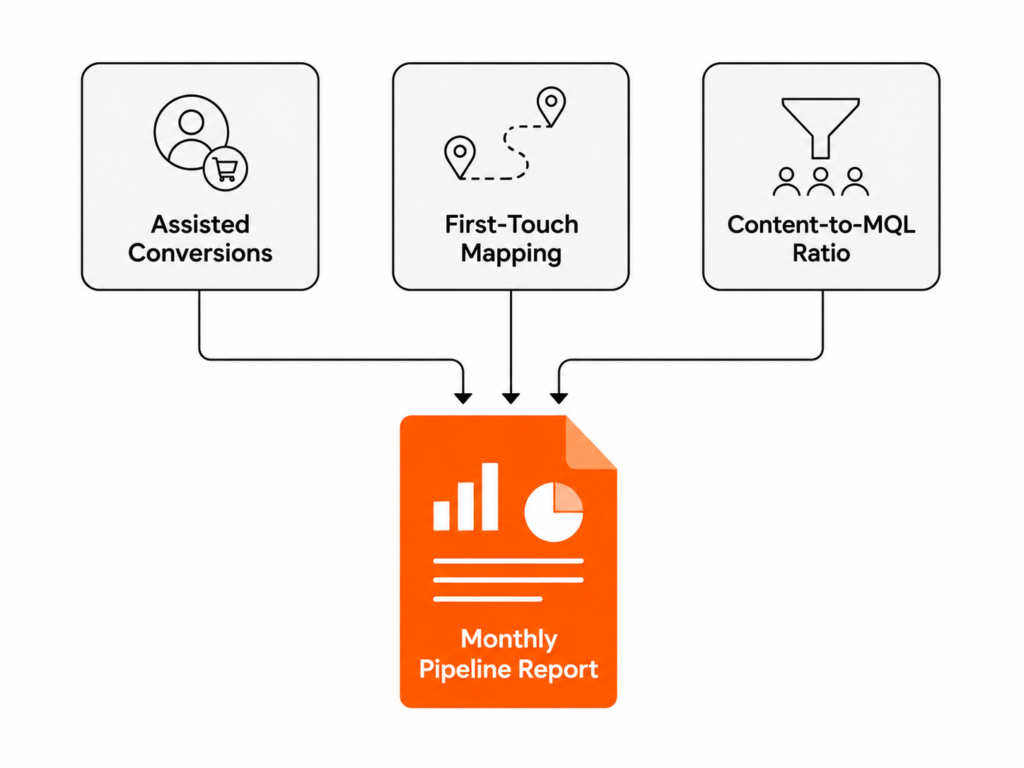
- Assisted conversions: tag every gated asset, demo request, and signup form with the last blog post the visitor read before converting (UTM parameters or a simple referrer field in your CRM handle this).
- First-touch content mapping: for a sample of closed-won deals each quarter, ask sales or check the CRM for the first content touchpoint in that account’s history. This doesn’t need to be automated; a monthly manual pull of 10 to 15 deals is enough to spot patterns.
- Content-to-MQL ratio by pillar: track how many MQLs originate from each content pillar over a rolling 90 days, not per article. Individual articles are too noisy to attribute reliably; pillars are stable enough to show a trend.
Report these three numbers together each month: assisted conversions this month, first-touch content share of closed-won deals, and MQL ratio by pillar. That combination tells a VP which pillars are pulling weight without needing a full attribution platform.
How it holds up in practice
This model is directional, not precise. It won’t survive an audit from a marketing ops team running proper multi-touch attribution, and it shouldn’t be presented as if it will. Be explicit in every report: this shows correlation and directional contribution, not a guaranteed causal link between a specific article and a specific dollar of pipeline.
It also breaks down in long sales cycles with many touchpoints. The “first touch” signal gets noisier the longer the deal takes to close. For those cycles, weight the pillar-level MQL ratio more heavily than first-touch mapping.
Who this is for
This fits teams of one to five content marketers without a dedicated marketing analytics function, reporting into a Head of Marketing or VP who wants a monthly pipeline update. If you already have a marketing ops team running proper multi-touch attribution in a platform like HubSpot or Bizible, use that instead. This model is a stopgap, not a replacement for real infrastructure.
Common mistakes
The most common mistake is over-claiming: presenting the Three-Touch Model’s numbers as precise attribution instead of a directional estimate. A close second is tracking at the individual-article level instead of the pillar level, which produces noisy, unreliable numbers that erode trust in the report over time. Teams also frequently forget to loop in sales to confirm the first-touch data, relying purely on marketing automation tags that miss offline touchpoints.
FAQ
Do I need marketing attribution software to start this?
No. A CRM with a custom field for “first content touch” and UTM tagging on your CMS covers the basics.
How often should I report this?
Monthly, aligned to whatever cadence leadership already expects for marketing reporting.
What if sales won’t confirm first-touch data?
Start with a smaller sample. Even 5 deals a quarter builds a pattern over time, and most sales teams will help with a handful of deals if you frame it as a quick favor, not an ongoing ask.
Should I attribute revenue, not just MQLs?
Once the MQL-level model is stable and trusted, extend the same logic to closed-won revenue. Don’t try to do both at once.
Is this the same as marketing mix modeling?
No. Marketing mix modeling is a statistical approach for larger budgets and longer data histories. This model is a manual, lightweight substitute for smaller teams.
Next step
Pick one gated asset and start tagging its traffic source this week. That’s the first input the Three-Touch Model needs, and the pillar-level view compounds once a full quarter of data is in. Once the numbers are stable enough to trust, document the reporting process itself so it survives past whoever owns it today. See how to turn a one-off process into a documented SOP for the framework.
What would you add to this framework?